
Differential ETL | Part 2
"Bring compute to the data"


Welcome to the sequel and the final post of Differential ETL we shared about last week. If you missed Part 1, you can find it below for a quick read.

Alrighty! Let’s dive deeper into what Differential ETL means with a specific example. We will wrap up by highlighting other examples where this will become powerful.
Federated Analytics
Federated analytics is a case of differential ETL, where data is in multiple private silos, and the aim is to extract meaningful information from the data across the silos.
This paper talks about Federated Analytics in more depth if you are interested in a literature review. Google wrote a blog detailing how Federated Analytics can accelerate data science.
The diagram below shows a simple schematic of what federated analytics looks like.

According to the diagram above, this demonstrates data in several heterogeneous systems (databases, data lakes, files, etc.). The compute environments around these could also be different from each other (bare metal, Kubernetes, on-prem vms, phones, etc.). The goal is to send one or more workload to extract some key information back as result.
To sum up:
Data and app teams create a workload - think of this as the ETL pipeline. HOT-G’s Rune container technology is designed for this.
Optionally the security team(s) could review what is in the workload. This verification can happen programmatically with HOT-G tools.
Workloads are then federated / distributed to every participating compute node. This topographic setup can be dynamic too!
The workloads are run on each silo, and the resulting computed results (reduce) are aggregated back. This could happen in another trusted compute node or a 3rd part even.
It is important to note that the workloads don’t fetch all data back, instead they run some form of map ETL function.
The differential bits come in if you want to send different workloads to different nodes as the underlying data could be different.
Demo
Let’s look at this with the lens of a real-world example. Pharmaceutical companies are looking to monitor the drug on patients after it is launched. The monitoring could be as part of the post market surveillance of the drug or even during the trial to understand the survival rate. They are keen on measuring some critical information from several sites (hospitals / providers) to learn about the drug characteristics of patients.
Sites / Providers / Hospitals do not share the actual diagnosis and medical record data due to compliance, conflict, and regulation in general.
Federated analytics is a perfect solution for this problem. The top part of the schematic below explains the setup.

The bottom part of the above schematic shows the demo setup. We’ve thoughtfully chosen a simpler setup to show the demo. We are demonstrating silos of data across simulated data on desktop browsers and phone browsers.
We are computing the mean (average) and standard deviation of the age of the patients who have recovered. In fact, the filtering of the data itself could be part of the workload - for example: find the mean and median age of patients who have shown allergic reactions to the drug.
Watch the demo video below for the full experience.
Dynamic updates with HOT-G platform
If you saw the video, we changed the metric to track in the workload. The ability to dynamically change differential workloads and recompute other analytics is a powerful paradigm.
The self-explanatory sequence diagram below describes the operations in the demo.
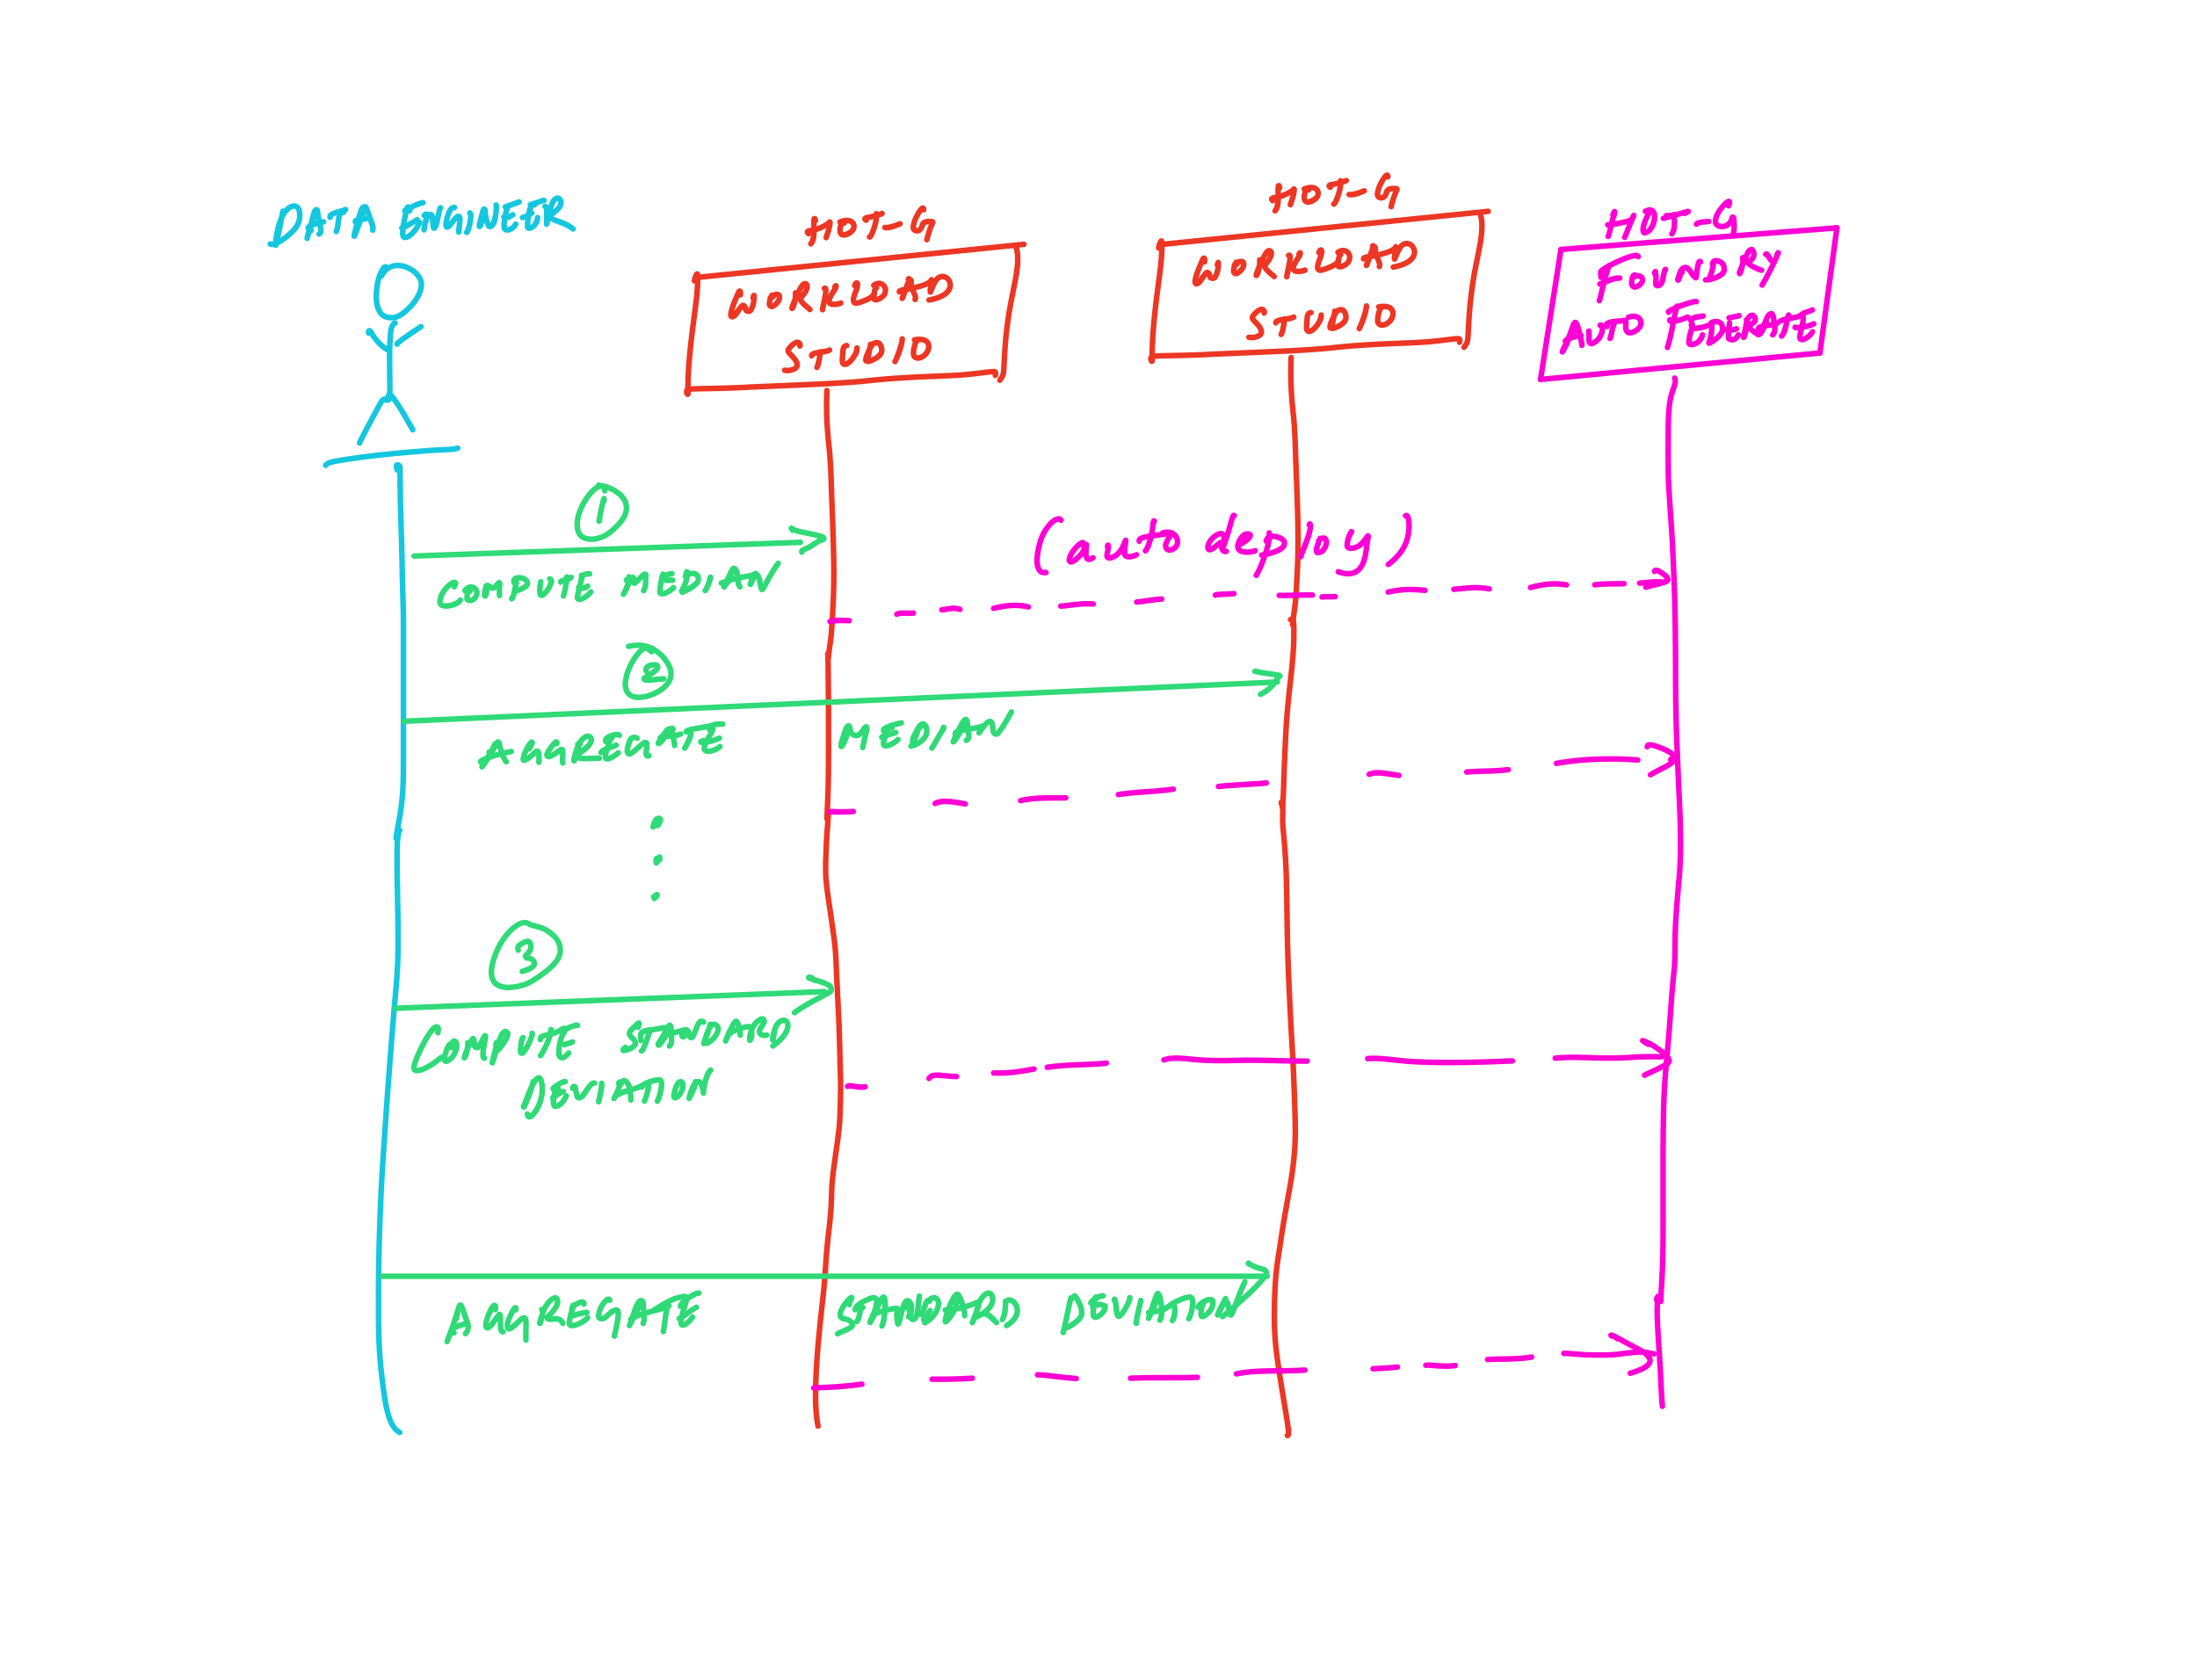
This all happens without having to change a single line of code! This is the true power of HOT-G’s zero code build and deploy platform. Moreover, we can run the workload anywhere. This is because we are maximally portable as well.
Future extensions
With HOT-G’s platform, the possibilities are endless. Soon, our team will be supporting the following on our platform:
Workload manager for security and infrastructure teams - the platform provides a zero-trust based workload management tool where security teams can decide the access privileges per silo. This is configured using OPA based policies.
SQL like interface for querying - The workloads in our example were built using our zero code drag and drop interface. We are adding an SQL interface so analysts can run their favorite aggregate queries. Power to the people!
Private and secure algorithms/workload - In many situations, the workload might need to be built using proprietary algorithms/models. Now, HOT-G can computationally protect this with our technology. We have written in the past about our original work in the space of Edge SecOps - protecting workloads on any edge. We are bringing it all home with these efforts!
Conclusion
To show how repeatable and big this market is, lets count the ways, shall we?
These are only feasible because we have highly portable container technology that can be easily secured, built, and deployed continuously with minimal effort.
Analytics on streaming data such as video and audio - rune containers can do aggregation on rich edge data - without requiring any code.
Data harmonization - data silos mean there are schema differences and data changes continuously. Now, you can reign in the complexity with Rune workloads that monitor and auto-normalize schemas (and data).
Data mesh based unified analytics - Our platform lets you build data mesh where you can interoperate across data silos and vendors by not having to move the data.
ESG reporting - Sustainability is a big market and ESG reporting is inherently hard due to how fragmented the data is. HOT-G can compute the metrics on data anywhere.
AI ad-tech analytics - Runes workloads can be used to run simple small models on web pages to do dynamic triggers. Third party analytics are mostly focused on click-stream data, but with Runes you can make a first party rich analytics capture to personalize browsing experiences.
The possibilities are endless.
HOT-G Socials:
Twitter @hotg_ai and @hammer_otg | LinkedIn | Discord